Part Two
Stop Blaming Generations
The generational explanation is the one most program plans rest on. It fails three separate tests — and the gap it distracts from is ten times larger.
The values gap barely registers.
Every generation wants roughly the same thing from work. The evidence on this is unusually strong.
So much for the structural story. Now the generational one — the explanation most CSR decks reach for, and the one that does not hold.
Deloitte surveyed 22,595 young workers across 44 countries in 2026. Gen Z and Millennials came out 1 point apart on whether purpose matters to job satisfaction: 96% and 97%.
EY surveyed 5,000 full-time white-collar employees at large US employers in mid-2025. It found 48% of Gen Z and 47% of Millennials wanting an employer that reflects their values, against 44% of all respondents. That is 4 points between the youngest group and the workforce as a whole.
EY publishes no group-by-group table, so the true distance from youngest to oldest is unknown. Since both young groups sit above the average, the older ones sit below it by some unstated margin.
Then there is the finding that should give the whole field pause.
Ravid, Costanza and Romero published a meta-analysis in the Journal of Organizational Behavior pooling 143 independent samples and more than 158,000 people. On 3 of the 4 work-value categories they coded — including social and altruistic values, the exact thing "young people want purpose" claims — they found no statistically significant differences between generations.
The moderator result closes the argument. If generations were shaped by shared historical events, people raised in different countries should differ from each other. Across the 46 generational comparisons where the authors tested country as a factor, not one estimate differed between US and international samples.
What is likely left is age and career stage wearing a generational costume.
The people who publish the charts stopped trusting them
In May 2023 Pew Research Center — whose generational charts are the ones everybody screenshots — announced it would stop producing most of them. The statement is worth quoting directly.
“We'll only do generational analysis when we have historical data that allows us to compare generations at similar stages of life,” wrote Kim Parker, its director of social trends research. And, on the state of the field: “The field has been flooded with content that's often sold as research but is more like clickbait or marketing mythology.”
The reason is not squeamishness. It is arithmetic. Age, period and cohort cannot be separated, because any one of them is exactly calculable from the other two — if someone was 50 years old in 2016, they were born around 1966. Pew's own explainer gives the example cleanly: when Millennials show a lower marriage rate in 2016, there is no statistical way to know whether that is a generational difference or simply what people aged 23 to 38 look like.
This is not a solved problem waiting on better data. A 2019 review in the Annual Review of Sociology opens by noting that despite “hundreds, if not thousands, of articles and dozens of books, there is little agreement on how to adequately analyze” it. The current state of the art is bounds and sensitivity analysis, not estimates.
So when a deck tells you what Gen Z wants, it is comparing people who are currently young to people who are currently not. That comparison can be interesting. It cannot distinguish a generation from a life stage, and almost nobody selling it says so.
"Even if generational effects do not exist, the fact that people believe in and use generational identities means they can have very real and often harmful effects in workplaces."
Ravid, Costanza & Romero, Journal of Organizational Behavior · In a companion review of 137 articles, the same paper found 69% offered generation-based recommendations to organizations anyway.
Two behavioral differences do survive. Gen Z is more willing to act on values: 41% report turning down an assignment over personal ethics and 41% a potential employer, against 37% and 39% of Millennials. These are self-reported lifetime behaviors, not annual quit rates, and Deloitte surveys only the 2 youngest groups, so they say nothing about Gen X or Boomers.
And Gen Z is far more likely to feel constrained. In research by O.C. Tanner, which sells employee-recognition software, 49% of Gen Z say they feel pressured to suppress their values at work, against 26% of Boomers.
That is a difference in permission, not in conviction. And permission is something an employer controls.
The gap that matters is the on-ramp.
Generations do not disagree about why to give. They disagree enormously about how.
Put the values questions next to the mechanical ones and the difference is hard to miss.
4 points on wanting a values-aligned employer. 44 points on preferring to give monthly. 40 points on paying by digital wallet. 52 points on whether you can be reached on TikTok.
Where the generational gaps actually are
Spread in percentage points between the highest and lowest group each source reports
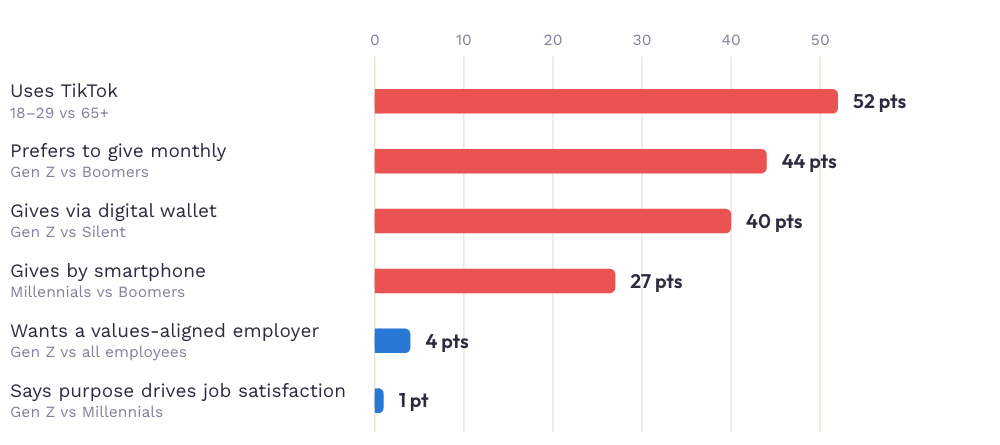
Table view
| Measure | Groups compared | Spread (pts) |
|---|---|---|
| Uses TikTok | 18–29 vs 65+ | 52 |
| Prefers to give monthly | Gen Z vs Boomers | 44 |
| Gives via digital wallet | Gen Z vs Silent | 40 |
| Gives by smartphone | Millennials vs Boomers | 27 |
| Wants a values-aligned employer | Gen Z vs all employees | 4 |
| Says purpose drives job satisfaction | Gen Z vs Millennials | 1 |
The channel gradients are steep and consistent. Preference for monthly giving runs 62% among Gen Z, 58% Millennials, 35% Gen X, 18% Boomers. Digital-wallet share of gifts runs 61% for Gen Z down to 21% for the Silent Generation. Smartphone giving: Millennials 54%, Gen X 43%, Boomers 27%.
And the dollars move opposite to the frequency. In the 2024 giving year, Boomer donors averaged about $3,256 against Gen Z's $867. An earlier wave of the same series found Gen Z spreading its giving across more gifts — 11.4 a year to Boomers' 8.3.
Younger people give more often and smaller. Older people give less often and larger. That is a payments problem, not a commitment problem.
It looks like a generation. It measures a bank balance.
Before accepting that young people give less because they are young people, it is worth removing the money.
The Lilly Family School did the arithmetic on the whole decline. 36% of the fall in household giving participation is explained by declines in income, wealth and home values alone — and 44% of the fall in secular giving specifically.
Then there is a natural experiment nobody set up on purpose. Bank of America and the same school survey affluent American households — income above $200,000 or a million dollars in assets outside the primary home. In that population, households headed by someone born in 1981 or later gave at 79%. Households born before 1981 gave at 87%.
An 8-point gap. In the general population, the equivalent age comparison runs closer to 50 points.
Hold that loosely: these are 2 different studies, 8 years apart, splitting age at 30 in one and 42 in the other, and affluent young people are an unusual group. It is not a controlled experiment. But the direction is hard to argue with, and it is the direction the panel data already pointed.
The life-stage evidence stacks the same way. Homeownership among households headed by someone under 35 fell to 36.3% at the end of 2024, down 1.8 points in a year — the only age group that moved. Marriage and children arrive later than they used to. Every one of those predicts giving, and every one of them has shifted against people currently in their twenties and thirties.
The number that should end the argument
Here is the cleanest way to see what generational survey data actually measures.
In 2024 Blackbaud surveyed about 1,300 Gen Z adults. Among those whose employers offer the programs, 89% said they take part in workplace giving and 92% in workplace volunteering.
Now the transaction logs. CECP's 2025 survey of large employers puts matching-gift participation at 21% and volunteer participation at 25%. Benevity, which processes the transactions rather than asking about them, recorded volunteer program participation of 13.6% in 2025.
These three do not measure the same thing and should not be subtracted from each other. Blackbaud's base is narrow and self-selected, and it does not publish how many people are in it. CECP surveys a couple of hundred large companies a year. Benevity counts its own client base. Each is a different population.
But run it at its most generous to the survey — take the self-report at face value, compare it only to companies that definitely have a program — and stated participation still runs somewhere between 4 and 7 times what anyone measures.
Survey questions measure willingness. Transaction logs measure enrollment. The gap between them is not Gen Z lying. It is the distance between wanting to take part and completing a form — which is exactly where a program can intervene, and exactly what a values strategy cannot touch.



Same gesture, three age bands. The values questions barely separate them; the payment questions separate them by 40 points and more. Monthly-giving preference: Giving USA / Dunham+Company, Giving by Generation, 2022 wave. Digital wallet: GiveCampus, 2023 transactions, higher-education donors only. Smartphone giving: Giving USA / Dunham+Company, 2024 giving year. Photography: momoGood image library.
How each generation prefers to transact
Preference for monthly giving (labelled) and digital wallet share of gifts. Both gradients run the same direction.
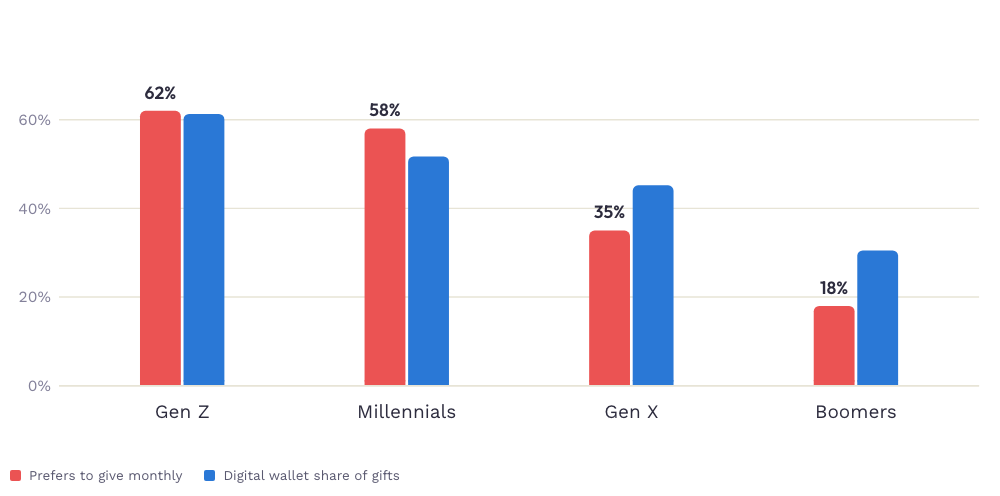
Table view
| Group | Prefers monthly | Digital wallet |
|---|---|---|
| Gen Z | 62% | 61.3% |
| Millennials | 58% | 51.7% |
| Gen X | 35% | 45.2% |
| Boomers | 18% | 30.5% |
And the technology gap is not where you think
You would expect these differences to show up as a Gen Z technology preference. Mostly they don't.
Deloitte has Gen Z and Millennials at an identical 74% using AI in day-to-day work. Microsoft's 2026 Work Trend Index profiled its most advanced AI users across 20,000 knowledge workers in 10 markets. That group is 50% Millennial, 23% Gen X, 22% Gen Z and 4% Boomer.
Read that carefully: it is the makeup of the advanced-user group, not each generation's rate of advanced use, and it partly reflects how many Millennials are in knowledge work to begin with. What it does establish is that the advanced-AI group is not disproportionately Gen Z — which is the assumption most program plans rest on.
The real cliff is further up the age range. Randstad found 42% of Gen X and 56% of Boomers never using AI at all.
Gen Z's enthusiasm is also falling, not rising. Gallup surveyed 1,572 people aged 14 to 29 in late February 2026. Excitement about AI dropped from 36% to 22% in a year, while anger rose from 22% to 31% — with the steepest declines among daily users. And 58% of Gen Z and 54% of Millennials report digital fatigue from alerts and switching between tools.
Younger employees are not asking for more tools. They are the group most exhausted by the ones they have.
Nobody can tell you who volunteers.
The generational volunteering data everyone cites does not exist. Design for constraints instead.
I went looking for the generation that volunteers most, expecting to hand you a target. The data to support any such claim is not published.
AmeriCorps and the Census Bureau run the authoritative US survey — about 47,000 people, every 2 years. The 2023 wave puts formal volunteering at 28.3% — up from 23.2% in 2021, and 1.7 points below the 30.0% it ran at in 2019 — and informal helping at 54.2%, which is above its 2019 level of 51.7%. It measured virtual volunteering for the first time: 18% of formal volunteers served at least partly online.
What it does not publish is a rate per generation.
The line you will see repeated everywhere is that Gen X leads every generation in volunteering. I originally wrote that it could not be sourced. That was too strong, and the truth is more interesting: AmeriCorps says it itself. Its November 2024 press release states that Generation X, aged 43 to 58 in 2023, had the highest formal volunteering rate of any generation in each of the last 4 waves.
But the survey's published tables are by age band, not by generation. The generational ranking is an interpretation laid over those bands — by the agency in a press release, then by USAFacts in a chart, then by Statista, which sells the per-generation table and does not show non-subscribers where the numbers came from. At no point in that chain does a government statistical table report a volunteering rate per generation. There is no 2025 wave either, so even the national total is 3 years old.
And look at who Gen X was in 2023: 43 to 58 years old. Peak earning, peak homeownership, peak school-age children — the exact life stage that predicts volunteering whatever year you were born in.
The series also has a break in it. The pre-2017 survey and the redesigned one that replaced it use different wording and capture more activity, so the apparent rise from 24.9% in 2015 is largely an artifact.
Pointing the other way: GoFundMe and the GivingTuesday Data Commons pooled a year of weekly panel waves and found 35% of adults aged 18–29 had volunteered in the past week, against 25% of adults 30–85. Two respectable sources, opposite directions — because one measures formal volunteering across a year and the other measures any volunteering in a week.
So the picture is unresolved, and anyone selling you a generation to target is quoting an interpretation of an age band.
What did move, and it isn't participation
There is one clean finding in this data, and the sector mostly ignores it because it is about depth rather than headcount.
Hours per volunteer fell from 96.5 in 2017 to 70 in 2023. The median fell further, from 40 hours to 24 — a 40% drop for the typical volunteer. Benevity's platform data says the same thing from inside corporate programs: average hours per volunteer down from 16.4 to 12.7, with roughly 60% of volunteers now giving under 5 hours a year.
People are still showing up. They are showing up for less. And that rhymes exactly with the giving data in Part One — participation holding or recovering while the depth of the commitment erodes underneath it.
What is not unresolved is the constraint. CECP's 3-year matched data shows virtual volunteering, volunteer time off and flexible scheduling all declining, with company-wide days of service down 20.3% and return-to-office mandates implicated. The flexible formats are shrinking — and that falls hardest on whoever's time is least their own, which is a life-stage fact, not a birth-year one.
Part Two of Where the Giving Habit Went, a three-part momoGood research series. Every figure has been checked against a primary source; where a number could not be verified, the text says so. Charts are presented here as data tables.

Rebuilding the giving habit at work
Workplace giving is the one on-ramp most employers still control. See how momoGood approaches participation rather than program count.