
Part One
The Giving Habit Broke — But Generosity Didn't
Total charitable dollars hit a record. The number of households paying for them collapsed. The places that made giving routine — the congregation, and the workplace campaign — emptied out together.
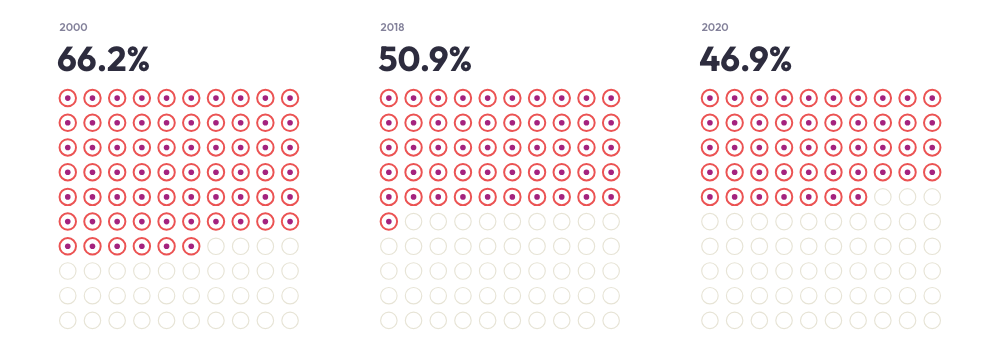
Every ring is 1% of American households. Filled rings gave to charity that year; hollow rings did not. Count them and the decline is the whole story: 66 households in every 100 gave in 2000, 51 gave in 2018, 47 gave in 2020. All three are published Philanthropy Panel Study readings. And it happened while total charitable dollars climbed to a record $617 billion — paid for by fewer, larger donors.
In CECP’s 2025 survey of large US employers, 25% of employees take part in the volunteer program and 21% use the matching-gift program — while 94% of those companies offer a match. CECP has run this survey for 25 years, across more than 650 multi-billion-dollar companies in total, and in August it gave the pattern a name: a participation ceiling. Companies keep adding new ways to get involved. They keep reaching the same people.
There are two standard explanations for this. The first says the programs are badly designed. The second says young workers want something older programs were not built to give them.
I checked both against the evidence. Neither one holds up.
The generational explanation fails because the values gap it depends on is somewhere between 4 points and zero. The program-design explanation fails for a more uncomfortable reason: the ceiling is not really yours. It is the workplace-shaped piece of a much larger decline — in how many Americans give at all, and in the institutions that used to make giving a habit instead of a decision.
That is the bad news. The good news sits at the other end of the same evidence. As trust drained out of nearly every institution over the past decade, it collected in one place. The employer.
Dollars up, donors down.
Charitable giving hit a record $617 billion in 2025. Fewer people than ever paid for it.
The Philanthropy Panel Study is the best instrument American philanthropy has. It rides inside the University of Michigan's long-running income survey, follows about 9,000 households over time, and asks them every 2 years whether they gave.
Because it tracks the same households year after year, it can tell a real change in behavior from survey noise. What it shows is a collapse.
In 2000, 66.2% of US households gave to charity. By 2018 it was about half — 49.6% on the school's 2021 estimate, later revised to 50.9%. By 2020 it was 46.9%. Roughly 20 million households stopped giving between 2000 and 2016, a 13-point drop in 16 years.
The share of US households that give to charity
Philanthropy Panel Study, 2000 to 2020
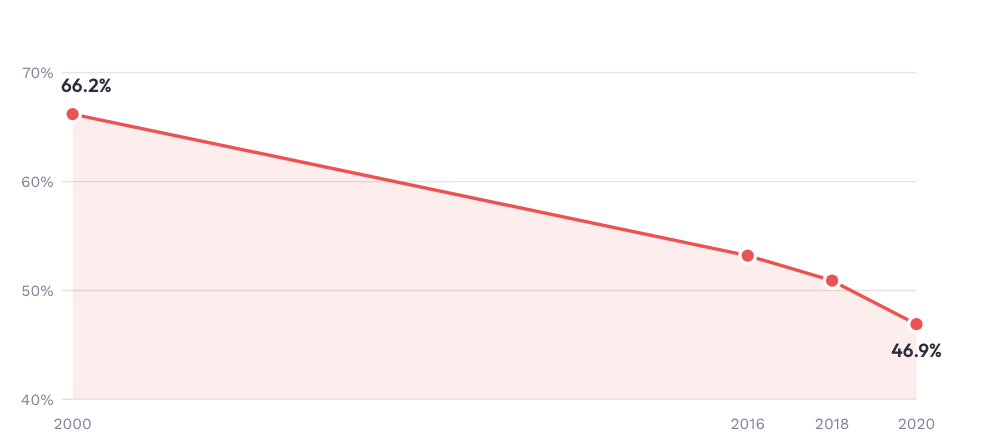
Table view
| Year | Households giving |
|---|---|
| 2000 | 66.2% |
| 2016 | 53.2% |
| 2018 | 50.9% |
| 2020 | 46.9% |
The near-term data says the trend continued. The Fundraising Effectiveness Project tracks about 15,000 nonprofits. It has now recorded 5 straight years of donor decline: −5.7% in 2021, −10% in 2022, −3.4% in 2023, −4.5% in 2024, −3.6% in 2025.
Donor retention bottomed at 42.6% in 2022, the lowest on record, and has barely moved since. The project's summary of the decade to 2022 is the cleanest statement of the problem: dollars rose 69% while donors fell 19%.
So where did the money come from, if not from more people? From fewer, larger donors.
In the 2023 panel, people giving $50,000 or more were 0.3% of all donors and 51.2% of all dollars. In the 2024 panel, people giving $100 or less were 50.8% of donors and about 2% of dollars — and they were leaving fastest, down 8.8% in a year. Those are 2 different years of the same panel, not one snapshot.
Most donors are small donors. Almost none of the money is theirs.
Every donor and every dollar tracked by the Fundraising Effectiveness Project in 2024, sorted by gift size
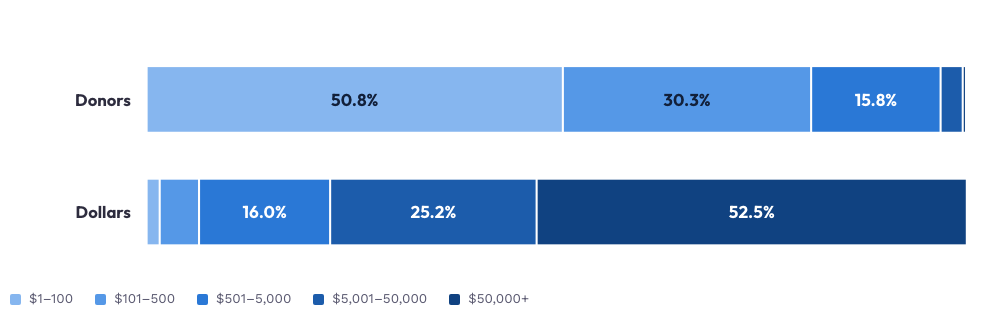
Table view
| Gift size | Share of donors | Share of dollars |
|---|---|---|
| $1–100 | 50.8% | 1.6% |
| $101–500 | 30.3% | 4.8% |
| $501–5,000 | 15.8% | 16.0% |
| $5,001–50,000 | 2.7% | 25.2% |
| $50,000+ | 0.4% | 52.5% |
Sorted by size, the exits run in a perfectly straight line. Donors giving $100 or less fell 8.8% in a year. $101–500, down 4.0%. $501–5,000, down 1.2%. Above $5,000, both bands grew.
Retention runs the same way and gets to the mechanism. 32% of the smallest donors came back the following year. 68% of the largest did. Small donors are not just leaving faster. They are the ones with nothing holding them in.
Giving USA says the same thing from the top down. Individual giving has fallen from 71% of the American total in 2015 to 63.9% in 2025. Foundations and bequests took up the slack, and both of those start in wealthy households.
Two things temper this picture. The project's panel comes from CRM vendors and leans toward small and mid-size organizations, so its levels are not sector-wide even where its direction is confirmed elsewhere. And Gallup, asking a looser question — any donation at all, no minimum — finds 76% of American adults donated in 2025, down from 83% in 2013. A real decline, but a much shallower one.
The careful version: household giving through nonprofits fell sharply. Total generosity, broadly defined, did not.
One finding cuts hard against the civic-collapse story, so it belongs here rather than buried. Volunteering has essentially recovered. Gallup put it at 63% in December 2025, up from the 56% pandemic low and 1 point off the 64–65% it ran at in 2008, 2013 and 2017.
Americans give their time at close to the rate they did 15 years ago. It is money participation that fell.

The campaign that disappeared.
The largest workplace giving campaign ever built lost 94% of its donors while the workforce it asks stayed the same size.
Everything above is about American households in general. There is a version of the same story that happened inside the workplace, and it is better evidence — because the number of people being asked never changed.
The Combined Federal Campaign
The federal government runs its own workplace giving campaign. It has run since 1961, it is administered by the Office of Personnel Management, and for decades it was the largest in the world. It is also the only workplace giving program in America whose results were, until recently, published.
In 2009 it peaked. Roughly 1.1 million federal employees gave, out of about 4 million solicited — a participation rate above 25% — and they pledged about $282 million.
By 2017 it was 169,000 donors, slightly more than 4% of 3.9 million. By 2024 it was more than 71,200 donors and $65.9 million.
Dollars fell 77%. Donors fell about 94%. And the denominator held: the federal government solicited roughly 4 million people in 2009 and at least that many in 2024, counting about 3 million civilian employees and 1.3 million active-duty military.
The same ask, the same workforce, a 94% smaller response
Federal employees giving through the Combined Federal Campaign
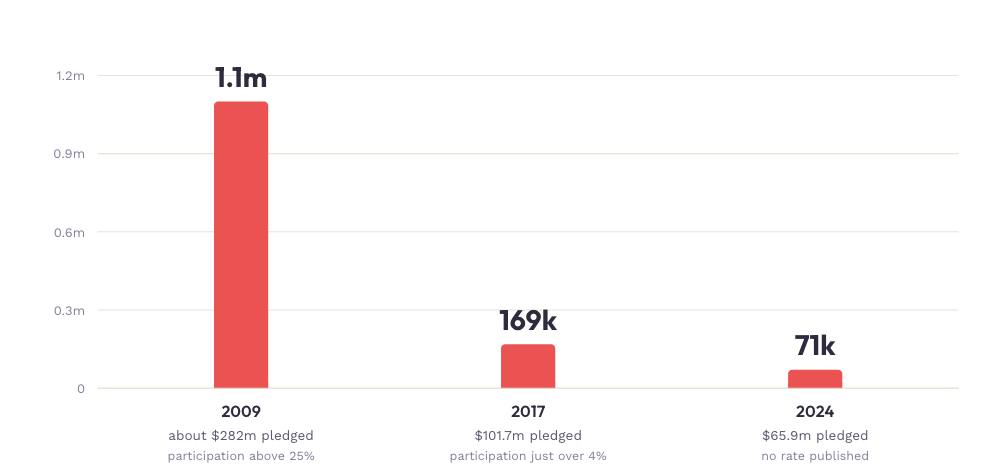
Table view
| Year | Donors | Pledged |
|---|---|---|
| 2009 | about 1,100,000 | about $282m |
| 2016 | not published | $167.0m |
| 2017 | 169,000 | $101.7m |
| 2024 | more than 71,200 | $65.9m |
That last caveat is the one worth sitting with, because it cuts both ways. Some of the collapse after 2017 is administrative. But the decline was already steep before anyone changed the rules: $282 million in 2009 to $167 million in 2016, a 41% fall with the campaign running exactly as it always had.
And the private-sector equivalent
United Way was built on the same machine: the annual workplace payroll campaign, run through employers, collected by deduction. It topped the Chronicle of Philanthropy's ranking of American charities almost every year from the list's 1991 debut until Fidelity Charitable — a donor-advised fund sponsor, which is to say a vehicle for the wealthy — took the top spot on 2015 data.
Support for its US affiliates was $3.87 billion in the year to June 2015 and $3.71 billion the year after, a 4.25% fall. Of 997 affiliates reporting comparable figures, 579 declined.
What happened next is genuinely hard to state, and that is itself the finding. United Way's 2023 annual report claims $4.4 billion raised and 5.4 million donors, with no note defining what is counted or which geography it covers. Its 2024 annual report drops network fundraising figures entirely. Meanwhile the Chronicle, reporting a departing chief executive's own numbers, puts affiliate fundraising at $3.15 billion in 2018 and $2.36 billion in 2023 — a figure the organization's own report appears to contradict by nearly a factor of two.
I am not able to reconcile those, and neither publisher states its method. What can be said is that the federation which invented American workplace giving no longer reports a consistent number for how much of it there is.
What thinned the habit.
The place that made giving routine for most Americans was a congregation. It emptied out, and nothing replaced it.
Two explanations survive scrutiny. They explain different things, and the sector overclaims on both.
Religion, which is the big one
Christian identification among US adults went from 78% in 2007, to 71% in 2014, to 62% in Pew's 2023–24 study. Americans with no religious affiliation went from 16% to 29%.
Here is the part most write-ups miss. The giving effect is not limited to the collection plate.
In Lilly School research, households where members attend worship regularly give to charities of all kinds at 62%. Households with no religious affiliation give at 46%.
That is a 16-point gap, and it extends to completely secular causes. The reason is that a congregation is not just a recipient. It is a place where you get asked regularly, by people you know, in a setting that makes giving normal. It is habit infrastructure.
Religion's share of American giving has fallen to match. It was 32% of all dollars in 2015 and just under 25% in 2025. Over that decade, religious giving grew 27% in raw dollars while total giving grew 65% — so it shrank in real terms while the sector expanded around it.
Which causes gained and lost share, 2015 to 2025
Each subsector as a percentage of total US charitable giving
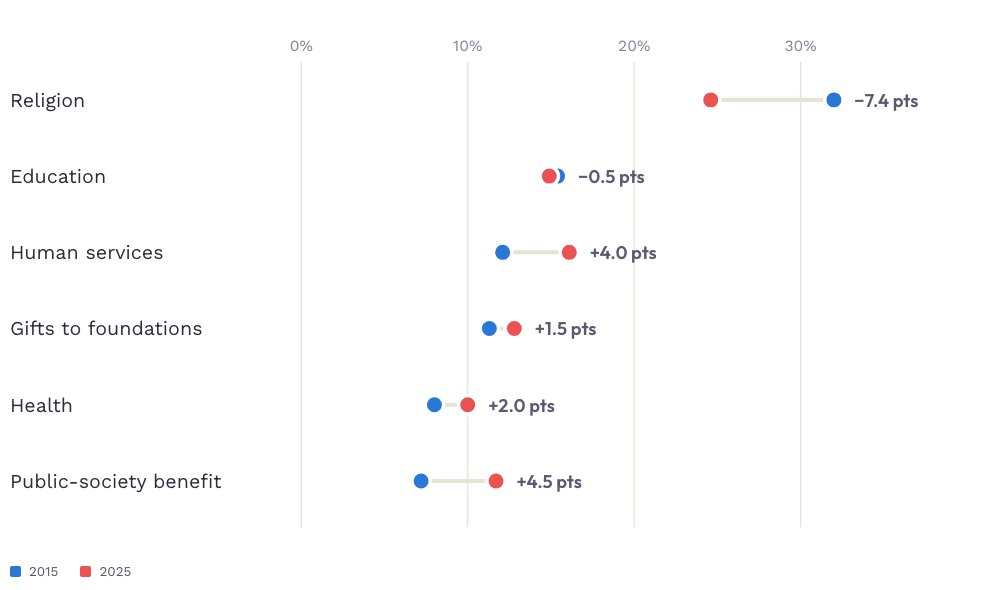
Table view
| Subsector | 2015 | 2025 |
|---|---|---|
| Religion | 32.0% | 24.6% |
| Education | 15.4% | 14.9% |
| Human services | 12.1% | 16.1% |
| Foundations | 11.3% | 12.8% |
| Health | 8.0% | 10.0% |
| Public-society benefit | 7.2% | 11.7% |
The 2017 tax law, which is the cleanest estimate
The Tax Cuts and Jobs Act roughly doubled the standard deduction. The share of households itemizing fell from about 21% to about 9%.
Among middle-income households, the share claiming a charitable deduction fell from about 17% to 5.5% — a drop of roughly 67%. Even in the 90th–95th income percentile it fell from about 78% to 40%.
Three economists — Han, Hungerman and Ottoni-Wilhelm — measured the effect using the same panel data, published as NBER Working Paper 32737. Their finding: the law cut charitable giving by about $20 billion a year, having removed the tax incentive for roughly 20% of taxpayers. That is the best-identified causal estimate in this whole subject.
It is also small next to the size of the decline. And household participation had already been falling for 17 years before the law passed.
The tax law sped up a trend. It did not start one. The more important effect is who gets the incentive: the charitable deduction is now concentrated among the wealthy, which reinforces the concentration described above.

What happened inside the workplace.
Employees expect purpose at work more than ever. They feel it less than at any point on record.
Over the same decade, the ground your program stands on shifted too. One number tells the whole story.
Gallup's engagement survey includes this statement: the mission or purpose of my company makes me feel my job is important. In March 2020, 38% of US employees strongly agreed. By February 2024 it was 30% — a record low. It recovered to 32% in mid-2025 and has softened since.
Now hold that next to the figure the entire purpose industry quotes: 96% of Gen Z and 97% of Millennials telling Deloitte that purpose matters to their job satisfaction.
Purpose expectation is at an all-time high. Purpose connection is at an all-time low. That gap is the participation ceiling, measured from the inside.
Deloitte 2026 Gen Z and Millennial Survey (22,595 people, 44 countries) · Gallup, US employees, March 2020 through 2026
US employee engagement rose to 2020, then gave it all back
Percentage of US employees Gallup classifies as engaged, annual averages
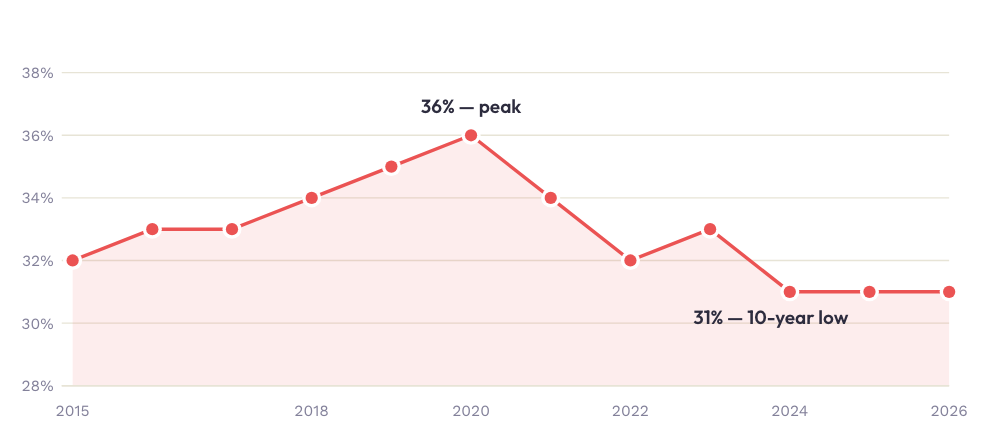
Table view
| Year | Participation |
|---|---|
| 2015 | 32% |
| 2016 | 33% |
| 2017 | 33% |
| 2018 | 34% |
| 2019 | 35% |
| 2020 | 36% |
| 2021 | 34% |
| 2022 | 32% |
| 2023 | 33% |
| 2024 | 31% |
| 2025 | 31% |
| 2026 | 31% |
Sources: Gallup, US employees, except manager engagement, which comes from State of the Global Workplace and is a global figure — Gallup notes US and Canada engagement held steady over that window. The job-search number is the striking one: the desire to leave has not moved in 11 years, while the quit rate fell by a third from its 2021 peak. Gallup calls the result the Great Detachment. People stay, and want out.
The manager number deserves more attention than it gets. Globally, manager engagement fell 9 points in 3 years while non-manager engagement barely moved. The sharpest declines were among managers under 35 and women managers.
Managers are the distribution channel for every voluntary program a company runs — giving campaigns, volunteer days, employee groups, wellbeing initiatives. If the layer that recruits participants has lost 9 points of engagement, a flat participation rate is a symptom. Adding an 8th program option will not fix it.
Part One of Where the Giving Habit Went, a three-part momoGood research series. Every figure has been checked against a primary source; where a number could not be verified, the text says so. Charts are presented here as data tables.

Rebuilding the giving habit at work
Workplace giving is the one on-ramp most employers still control. See how momoGood approaches participation rather than program count.