
Part Three
Make Giving Easy Again
Confidence fell in almost every American institution over the past decade. It collected in one — the employer. Here is what the evidence says to do with it.

Trust moved to the employer.
Confidence fell in almost every American institution over the past decade. It collected in one.
Gallup has tracked confidence in institutions since 1979. Compare 2015 with 2026 and nearly everything is down: organized religion 42% to 33%, the military 72% to 61%, television news 21% to 14%. The medical system fell from 39% to 28%, measured against 2016, since its 2015 reading was 37%.
Average confidence across the 9 longest-tracked institutions has fallen from 48% at its 1979 peak to 27% today.
Worth noticing what is not on that list. Gallup has asked about churches, banks, schools, newspapers, Congress, the police, the medical system and big business every year since 1979. It has never asked about charities. Anyone citing Gallup for public confidence in nonprofits is citing a question that does not exist.
Meanwhile, in Edelman's 2026 Trust Barometer, "my employer" is trusted by 78% of employees and is the most trusted institution in 27 of 28 countries surveyed. Business sits at 64%, NGOs at 58%, media at 54%, government at 53%.
One caveat belongs with that figure every time it is used, including here. Edelman asks the employer question only of people who have an employer, and compares the answer to questions the whole sample answers about institutions in the abstract. Part of the 78% is the base: employed people rating the specific organization that hired them and kept them. The ranking is still remarkable. The size of the gap is flattered by how it is measured.
The employer is the last institution people trust
Share expressing trust in each institution to do what is right, 2026
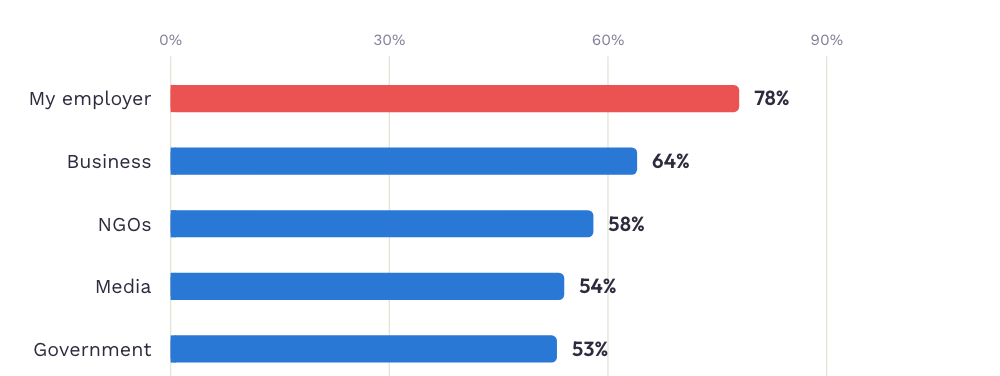
Table view
| Institution | Trust |
|---|---|
| My employer | 78% |
| Business | 64% |
| NGOs | 58% |
| Media | 54% |
| Government | 53% |
For the nonprofit half of this audience, one line in that report is the one to sit with.
NGO trust did not fall in 2026. It held flat at 58%, the only institution that did not gain. But 2026 is the first year in the barometer's history in which business is rated more ethical than NGOs — net ethics +20 to +17.
The sector's historic franchise was ethics. That advantage is now gone.
The domestic picture is more nuanced. Independent Sector's annual survey shows trust in nonprofits dipping to 52% in 2023 and recovering to 56–57%, where it has held for 3 years. Trust in philanthropy sits at 29% in 2026 — the lowest in the 6 years Independent Sector has asked, and down 4 points in a single year from 33%.
Americans still trust the organizations that deliver services. They are losing faith in the institutions that fund them.
And at the same moment, companies went quiet
The trust employers hold arrived exactly as their willingness to say anything publicly contracted. This is measured, not asserted.
- The Conference Board found use of the acronym "DEI" in S&P 500 filings down 68% in a year, "racial" down 58%, "diversity" down 33%. DEI metrics in executive pay fell from 68% of companies to 35%. Firms disclosing no board gender data at all rose from 1% to 29%.
- Gravity Research analyzed 1,378 Fortune 100 documents and found DEI language down 72% overall and the term "DEI" itself down 98%. It also found neutral substitutes like "belonging" and "inclusive" down 34%, which undercuts the theory that companies simply changed vocabulary.
- In 2025, 39% of surveyed companies planned to reduce Pride engagement and none planned to increase it — concentrated in external sponsorship, with internal employee-group activity largely intact.
- USC Annenberg surveyed communications professionals — the people who would write the statements, not the public — and found support for companies taking positions on issues unrelated to their business down 38% since 2020, with 41% saying silence can sometimes be the most effective strategy, rising to 52% among in-house communicators.
The counter-signal matters too. The Conference Board found formal board oversight of DEI actually rose from 72% to 79%, and its own read is "reframing, not abandoning." The work continued. The talking stopped.
What did the public want during all this? Not what you'd assume.
Bentley and Gallup asked annually whether businesses should take public stances on current events: 48% in 2022, 41% in 2023, 38% in 2024 — and then 51% in 2025, a 13-point rebound with gains in most demographic groups. The simple "the public wants companies silent" story is running on 2024 data. No 2026 reading has been published, so 1 year is all the evidence there is that the retreat has turned.
But the employee-specific finding cuts the other way, and it is the one for this audience. In that same 2025 survey, 60% of employed Americans would prefer their employer not communicate stances on current events to them directly.
Support for corporate speech in the abstract is not the same as appetite for being spoken to at work. Employees want the employer to do something. They are much less enthusiastic about being messaged about it.
What to actually change.
Stop running campaigns. Start being the thing that makes giving routine.
Put the 3 findings together.
Giving participation collapsed because the institution that made giving routine — the congregation — thinned out, and nothing replaced it. Values do not differ meaningfully across generations, so building 4 programs for 4 age groups solves nothing. But how people transact differs enormously, and the employer is now the most trusted institution in American life.
That points somewhere specific. The workplace is the only remaining mass institution that sees people regularly, is trusted by them, and can make an ask routine instead of exceptional.
What actually moves people, as far as anyone has measured it
Most advice in this field is assertion. There is a small amount of real evidence, and it points somewhere specific and slightly uncomfortable: the things that work are mechanical, and the things we spend our money on are rhetorical.
The default beats the pitch. When one large American employer switched its retirement plan from opt-in to opt-out in 1998, participation among comparable new hires went from 37% to 86%. Nothing about the plan changed — not the match, not the funds, not the communications. Only the box that was already ticked. And 61% of those automatically enrolled never moved off either default, the contribution rate or the fund, for as long as they were observed. That study has been replicated for 25 years and is the single most reliable finding in behavioral economics.
The friction is worth more than the argument. In 2013, researchers ran two experiments inside Google. Employees arriving at an internal giving page were randomly shown one of two ways to give: the existing route, which sent them to the charity's own site to enter a credit card, or a payroll-deduction option that completed on the spot. Same charity, same match, same words.
Among employees who reached the page in the second experiment, giving went from 38.5% to 59.1%. Average gift size did not change.
And the sector sets its own defaults backwards. M+R's 2025 benchmarks found that 90% of nonprofits offer a monthly giving option and 78% write copy encouraging people to take it — while 64% pre-select the one-time option on the form and only 35% pre-select monthly.
Seventy-eight percent of the persuasion, pointed at a box that sixty-four percent of us have already ticked the other way.
And the match itself may not be what you think
One more piece of evidence belongs here, and it comes from an organization with no stake in workplace giving at all.
GiveWell evaluates charities on cost-effectiveness and has spent 15 years being unpopular about it. Its donation page carries a standing recommendation:
“We recommend against letting ‘donation matching’ affect where you donate.”
The objection is counterfactual. When a campaign tells you your gift will be doubled, that is only true if the matching money would not otherwise have been given. Frequently it would have been. GiveWell's term for that case is illusory matching, and the 2011 post that introduced it is an account of the organization deciding not to run one itself:
“We'd be advertising that you can ‘double your gift,’ but the truth would be that we just restructured a gift from a six-figure donor that was going to happen anyway.”
They had gone looking for a real one first, and failed to find it:
“We've discussed whether we might be able to provide ‘true’ donation matching … but not surprisingly, everyone we could think of who would be open to making a large gift to our top charities would be open to this whether or not we could match them up with smaller donors.”
GiveWell does allow 2 cases where a match is real. In coordination matching, a funder will cover part of a specific total on condition that the rest gets raised. In influence matching, the matcher genuinely wants to encourage others and commits to give only if they do. Everything else is restructuring a gift that was already coming and putting a countdown clock on it.
GiveWell now runs matching campaigns of its own, which makes its candour about the difficulty more useful rather than less:
“It will be impossible to say with certainty that a matching donor would not have given but for the opportunity to provide matching funds, but we believe we can make a credible case following the above steps.”
Your program's job is not to run campaigns. It is to be habit infrastructure. 9 moves follow from that.
Treat payroll giving as infrastructure, not a campaign
A campaign asks once a year and measures dollars raised. Infrastructure makes the ask routine, makes participation automatic once chosen, and measures how many people have a standing habit. Move your headline metric from campaign totals to the share of employees with an active recurring commitment.
What collapsed over 25 years was not generosity — volunteering is back near 2008 levels. It was the routine. Households attending worship give to all causes at 62% against 46% for the unaffiliated, and the difference is being asked regularly, by people you know, in a setting that makes it normal. That is a describable mechanism, and an employer can reproduce it.
Change the default ask by age band, not the pitch
Recurring payroll deduction as the default for under-40s. A single annual gift as the default for over-50s. Same campaign, same case for support, different pre-selected option.
62% of Gen Z and 58% of Millennials prefer monthly giving, against 35% of Gen X and 18% of Boomers — a 44-point spread, roughly 10 times the values gap. And the default is not a nudge, it is the decision: 61% of people automatically enrolled in a retirement plan never changed a single setting afterwards. Whatever you pre-select is what most of your workforce will do, more or less permanently.
Fix payment friction before you touch messaging
Digital wallets. No account creation. No multi-step form. This is a conversion lever, and almost certainly the cheapest point of leverage in the whole program.
The Google experiments moved completion from 38.5% to 59.1% by changing nothing but the payment rail. M+R's 2026 benchmarks show where the friction sits now: mobile is 52% of nonprofit web visits and 43% of transactions but only 28% of revenue, and among people who reach a donation page it converts at 8% against desktop's 11%. One caution. Every published figure claiming a specific conversion lift from adding Apple Pay or Google Pay comes from a payments vendor, and not one of them discloses a method. Cut the steps because the experimental evidence says steps are what matter — not because someone sold you a percentage.
Resource the layer that recruits, and make taking part visible
Nobody enrolls because of a platform. They enroll because somebody near them did. Fund 20 minutes of manager enablement over a new platform feature — and make it easy to see that colleagues are taking part.
Manager engagement fell from 31% to 22% between 2022 and 2025 while non-manager engagement barely moved, with the steepest declines among managers under 35 and women managers. The distribution channel is the constraint. On peers versus managers, the evidence is thin and I am not going to oversell it. The one study that pits them against each other found a colleague's participation moved intentions far more than a supervisor's did — but it measured intentions rather than behavior, using written scenarios, with Chinese samples. The meta-analysis of corporate volunteering does not test manager encouragement at all. Fund both layers, and treat any vendor who tells you this is settled with suspicion.
Stop paying for a bigger match. Start proving the match is real.
Two cheap tests. Is the ratio buying anything — and would the money have been given anyway? Move the difference into whatever shortens the distance between an employee and a completed gift, then publish your match utilization so the promise on the form is one you can keep.
On the ratio. In the largest randomized test ever run on matching, 50,083 donors were assigned at random to no match, 1:1, 2:1 or 3:1. Announcing a match raised the response rate from 1.8% to 2.2% and revenue per solicitation by 19%. Raising the ratio above 1:1 did nothing at all: revenue per letter ran $0.94 at 1:1, $1.03 at 2:1 and $0.94 at 3:1, and the authors conclude that larger ratios “had no additional impact.” That was direct mail to an older, highly educated donor list in 2005, not a workplace campaign, so treat it as a hypothesis worth testing rather than a law — but it is cheap to test and the budget at stake is not small. On the counterfactual. GiveWell’s test is whether the matching money is additive — whether it would have gone to charity regardless. Corporate matching usually passes that test, because the company only pays when an employee gives. Two things can still break it: a budget that is quietly redirected when it goes unclaimed, and a cap that empties before the year does. And one more thing worth reading. GiveWell’s position on restricted corporate matching — matching only gifts to a company-chosen list — is that employees should push for it to be dropped, “rather than perpetuating a dynamic where your company’s corporate philanthropy team decides where you give.” That is a 15-year-old post written in one person’s voice, not institutional policy, and GiveWell has published nothing on employer matching since. It is still the sharpest thing anyone has written about the design choice you are probably making this quarter.
Lead with email, and don't ship another app
Put the program inside tools people already open. Every new surface is a surface someone has to remember.
Bloomerang's 2026 Harris Poll of 1,003 donors: 69% prefer email, a preference the report says holds across every generation, while nonprofit leaders prioritize social. M+R puts mobile messaging at 0.9% of all online revenue. And 58% of Gen Z report digital fatigue from switching between tools — the group you'd build the new app for is the one telling you it has too many.
Design volunteering around caregiving, not around youth
Evening and weekend slots. Short, self-directed projects. Opportunities someone can finish in 90 minutes. Then let everyone use them.
Since nobody publishes a defensible volunteering rate by generation, design for the constraint instead of the demographic. The constraint is documented: CECP's matched data shows virtual volunteering, volunteer time off and flexible scheduling all declining while company-wide service days fell 20.3%. A weekday-afternoon build day selects for people whose absence is easy to cover — which is not an age group, it is a job type.
Act more than you announce
Employees trust you more than they trust any other institution, and they are notably unenthusiastic about being messaged. Spend the trust on making participation easy and on showing outcomes, not on statements.
78% trust "my employer," the most trusted institution in 27 of 28 countries — while 60% of employed Americans would prefer their employer not communicate stances on current events to them directly. Meanwhile the Conference Board found board-level DEI oversight rising even as disclosure language fell 68%. Doing without saying is already the operating norm.
Measure first-time participation, and make your vendor show you
Report new participants as a share of all participants, split by hourly versus salaried, by site, and by remote status. Report repeat rate separately. Then ask your platform for the same cuts by age and tenure.
CECP found volunteers and workplace donors overlap by more than 11 points — the signature of a program serving the same people repeatedly. And I checked: CECP, Benevity, ACCP and YourCause all publish aggregate participation only. None segments by generation or tenure. They process every transaction with an employee record attached, so the data exists. It is simply unpublished.
Four numbers this field gets wrong.
Two are badly out of date. Two have no source at all. All four get quoted constantly.
The most-quoted generational giving figures in the sector date to roughly 2012. If you have seen "$1,212 for Boomers, $481 for Millennials" — and you have, it is everywhere — those numbers trace back through a page that never cited its source, then get recirculated by outlets citing that uncited page. Against November 2024 fieldwork, where Millennials average $1,616, the Millennial figure is off by more than a factor of 3.
And the flagship participation statistic is 6 years old. The Philanthropy Panel Study ends at 2020 and no 2022 or 2024 wave has been published. Everyone writing "fewer than half of Americans give" in 2026 — including this piece — is citing a pandemic-year reading. Say so when you use it.
The third has no source where it is cited. “Workplace giving raises about $5 billion a year” appears on the sector's most-linked statistics page with no citation and no year. It does trace, eventually, to a 2018 Indiana University estimate that the Urban Institute describes as imprecise — and which was quoted to argue that workplace giving is small, about 1.7% of individual giving. It is now 8 years old and describes a category that has shrunk since. If you need a number for the size of this channel, there isn't one.
The fourth has no source at all, and it is too low. “70% of donors abandon the donation page” traces to a vendor brief that actually says 50–70%, with no study, no sample and no method behind it. Meanwhile M+R's measured conversion rates — 11% on desktop, 8% on mobile — imply abandonment closer to 90%. The circulating figure is both unsourced and flattering.
None of these is a scandal. Together they are a pattern: this field runs on numbers that nobody has checked in years, in a sector whose entire pitch is accountability.
The Generosity Commission was created specifically to address this decline. It wound down after publishing in 2024. There is now no ongoing body measuring the thing the whole sector says it is worried about.
For 25 years, the institution that made giving a habit for most Americans was a congregation, and it has been emptying out. The employer is now the most trusted institution in the country and sees people every working day. If the workplace doesn't become the replacement, what does?
Part Three of Where the Giving Habit Went, a three-part momoGood research series. Every figure has been checked against a primary source; where a number could not be verified, the text says so. Charts are presented here as data tables.

Rebuilding the giving habit at work
Workplace giving is the one on-ramp most employers still control. See how momoGood approaches participation rather than program count.
More from The Goods.
Make Giving Easy Again
Confidence fell in almost every American institution over the past decade. It collected in one — the employer. Here is what the evidence says to do with it.
November 17, 2026 · 19 min readRead →Stop Blaming Generations
The generational explanation is the one most program plans rest on. It fails three separate tests — and the gap it distracts from is ten times larger.
October 15, 2026 · 17 min readRead →Houston Food Bank turned text into a top fundraising channel
A 904% ROI and a 1.01% conversion rate in their first year. A few lessons here for any nonprofit.
 October 14, 2026 · 4 min readRead →
Integrations
A–Z DirectoryBy category
Advocacy & OrganizingDonor ManagementEmail MarketingNonprofit CRMOnline FundraisingWorkflow AutomationView all categories →By use case
Donor SegmentationFundraising AttributionDonor StewardshipLapsed Donor ReactivationEvent MobilizationList GrowthAdvocacy MobilizationWelcome SeriesView all use cases →Cookie settings
Choose which cookies you allow. Your choice is saved and can be changed any time.
Your browser's Global Privacy Control signal is active — optional categories default to off.